Help
Table of contents
Uploading datasets
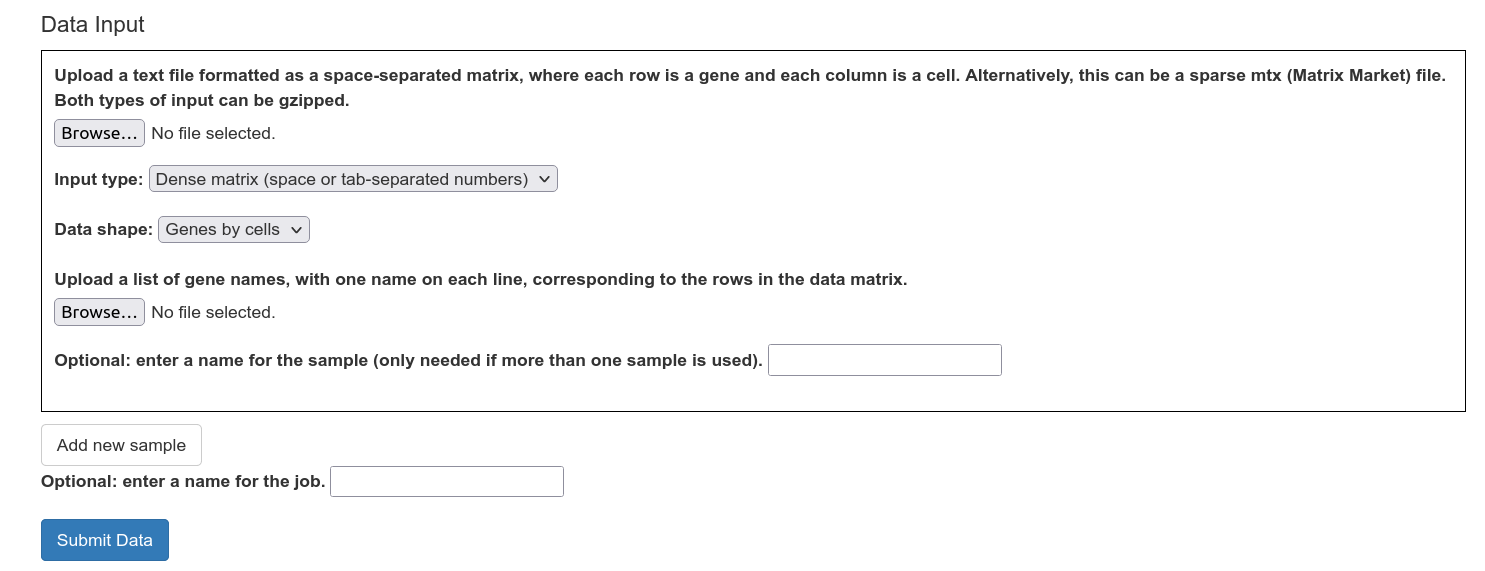
To upload a new dataset, select a data file containing a gene expression matrix. This file can be a sparse matrix file in Matrix Market format (.mtx, as produced by scipy.io.mmwrite) or a dense matrix as a space or tab-delimited file (as produced by np.savetxt). The file should not contain any headers or column names (e.g. gene names or barcodes). Make sure to indicate whether the file is genes-by-cells or cells-by-genes. The input file may be gzipped.
Multiple datasets can be uploaded together; these datasets will be combined. In order to upload multiple datasets to be combined, click on the "Add New Sample" button, and give a name to every dataset.
Running uncurl
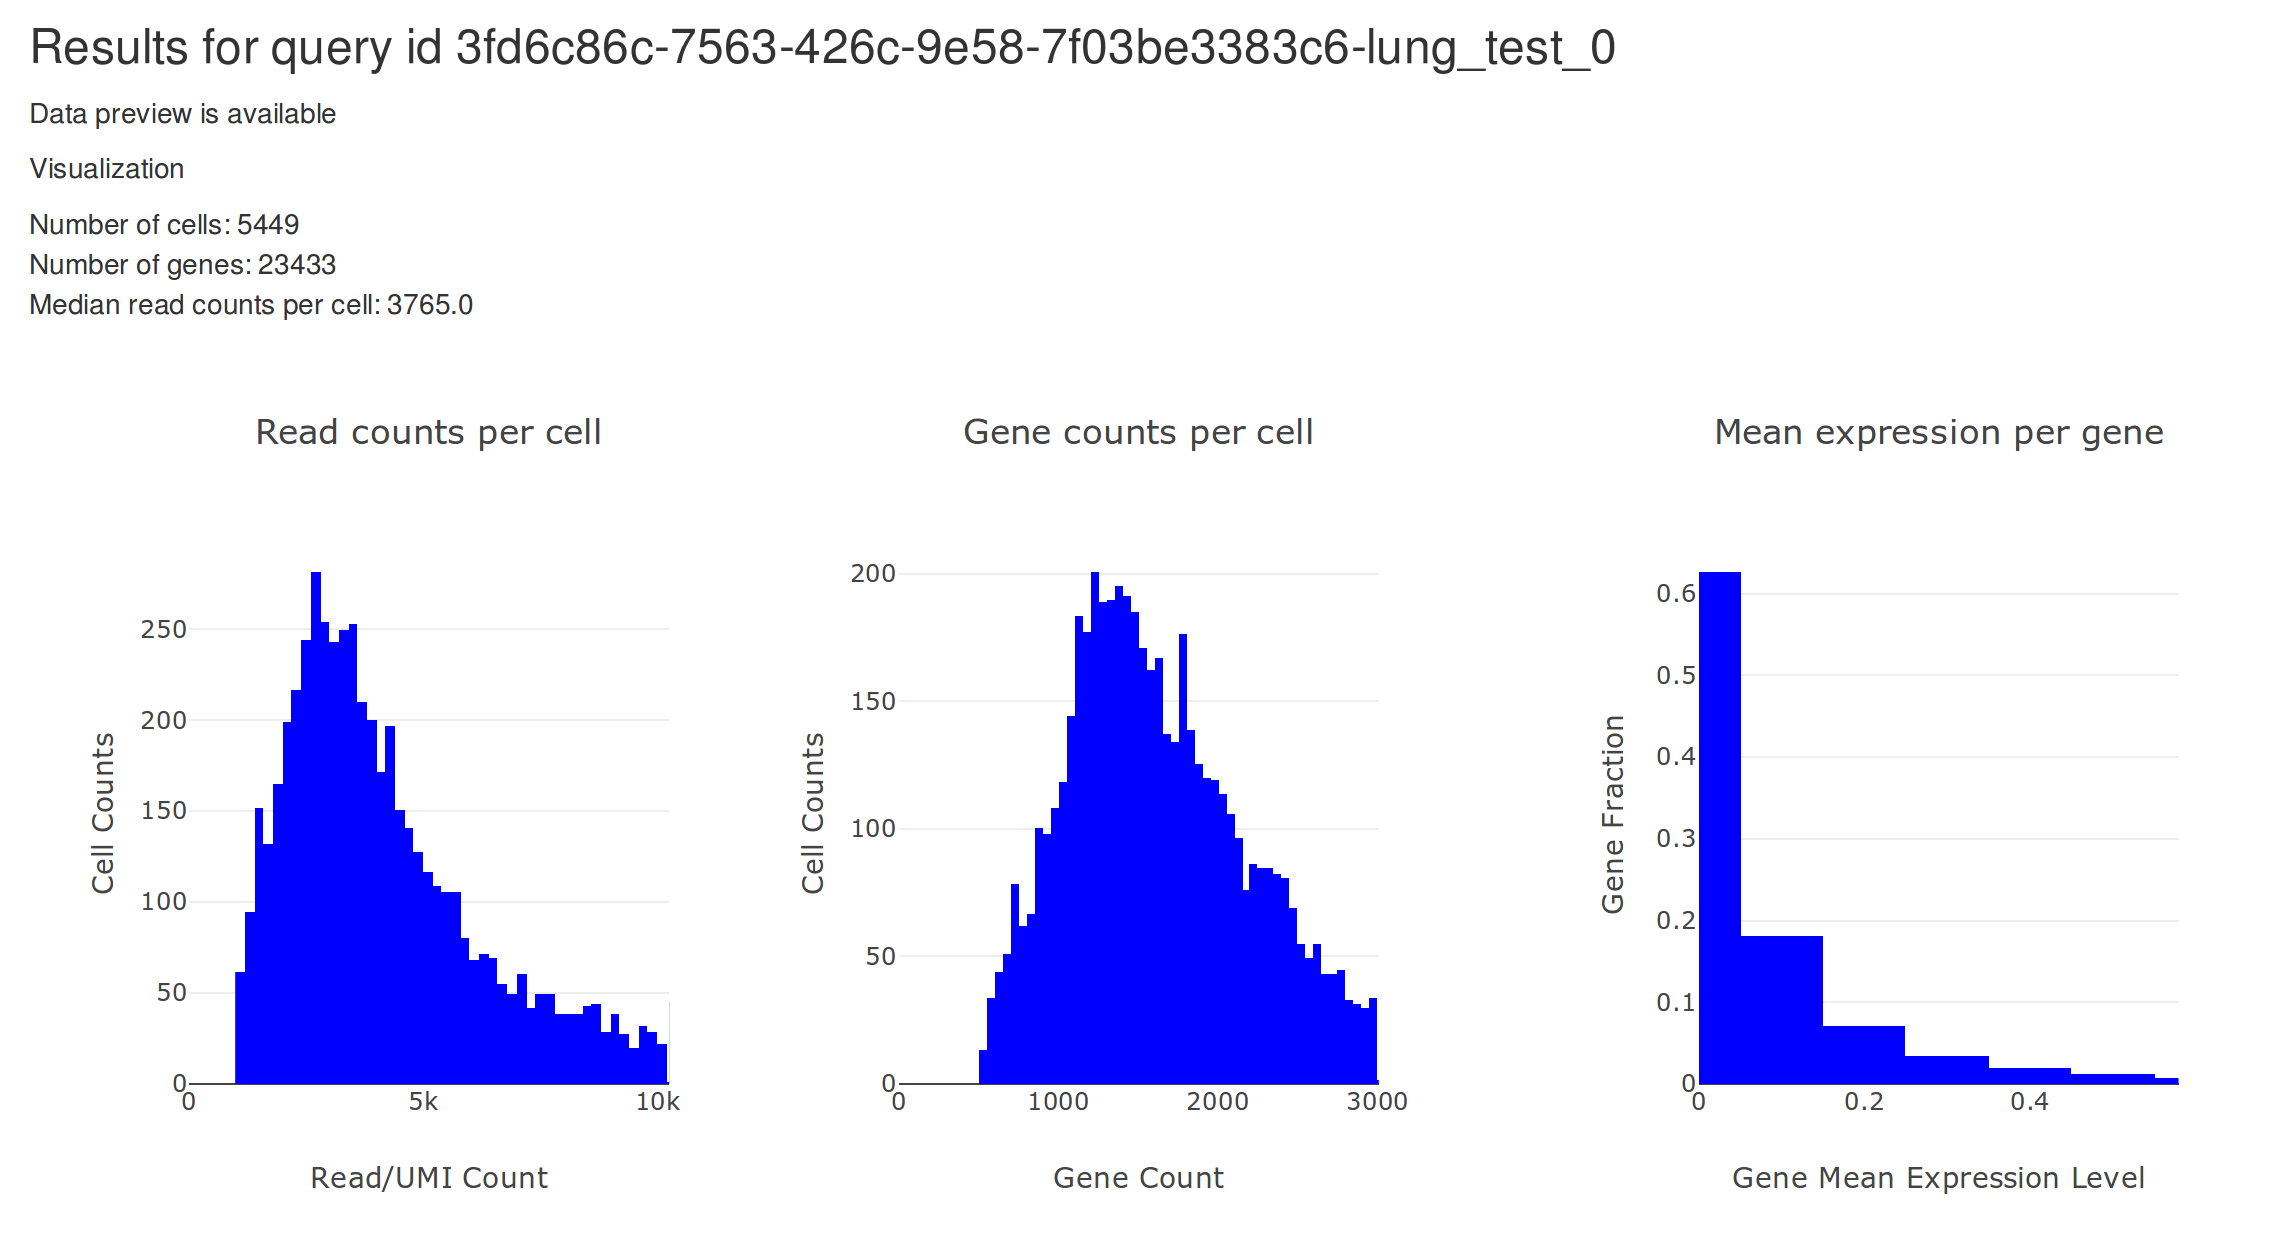
After uploading the data, you will eventually be redirected to a view that looks like the one above. On the top, there are two plots. The plot on the left shows the distribution of total read counts per cell. The plot on the right shows the relationship between mean and variance for all genes.
Uncurl options
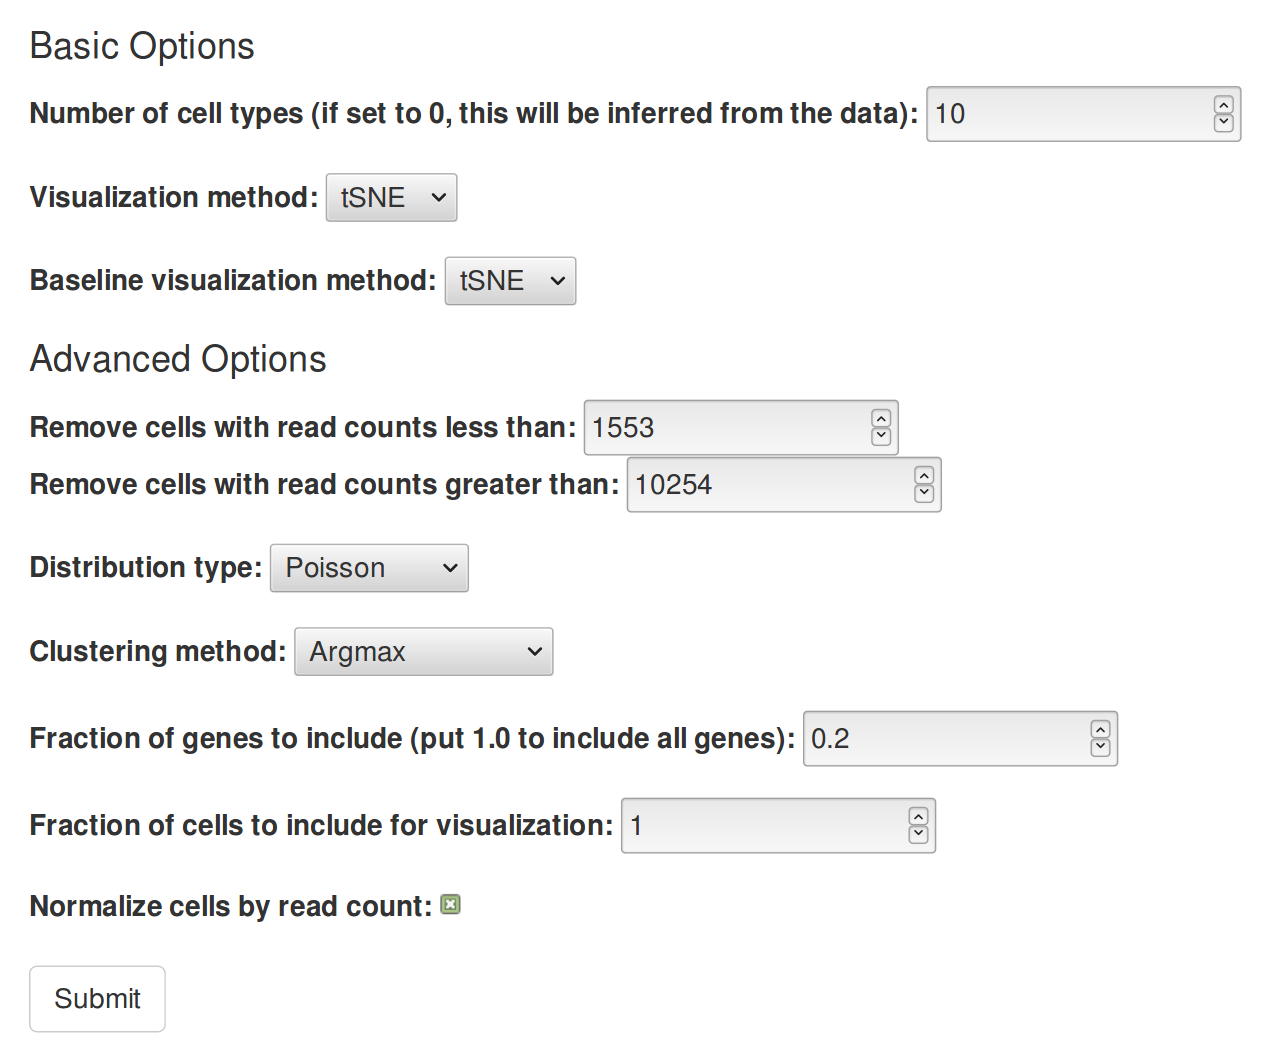
- Number of clusters: If the number of cell types is known, use the number of cell types here. Otherwise, this can be set to 0, which automatically infers the number of clusters using a gap score metric. Alternatively, setting this to between 10 and 20 usually produces reasonable results (clusters can be merged or split later on).
- Baseline visualization method: How to create a scatterplot of cells without using Uncurl. One of PCA, tSNE, or UMAP. Default: tSNE.
- Visualization method: How to create a scatterplot of cells using the output of Uncurl. One of MDS, PCA, tSNE, or UMAP. Default: tSNE.
- Remove cells with read counts greater/less than: This should be self-explanatory. Cells removed this way will not be used in the downstream processing. The default is to remove the top and bottom 5% of cells by total read count. If you want to include all cells, set the first number to 0 and the second number to a very high number.
- Distribution: For UMI or count-valued data, Poisson usually is best. For normalized counts (FPKM, RPKM,...), you might want to use log-normal. If the data has already been log-transformed, Gaussian might be preferable. Default: Poisson.
- Fraction of genes to include: As a preprocessing step, Uncurl selects a subset of genes for inference using variance-based selection: binning the data into 5 bins by mean expression level, and selecting the top k fraction of genes by variance. By default, this is 0.2.
- Fraction of cells to include for visualization: If there is a large number of cells, then the number of cells can be subsampled for the dimensionality reduction, to reduce computational and data transfer requirements. By default, this sets it so that the number of cells retained is at most about 10000. Set this to 1.0 to include all cells.
- Normalize cells by read count: If this is set to true, then for all cells, the read counts will be divided by the total read count for that cell, and then multiplied by the median read count for all cells. Default: true.
User interface
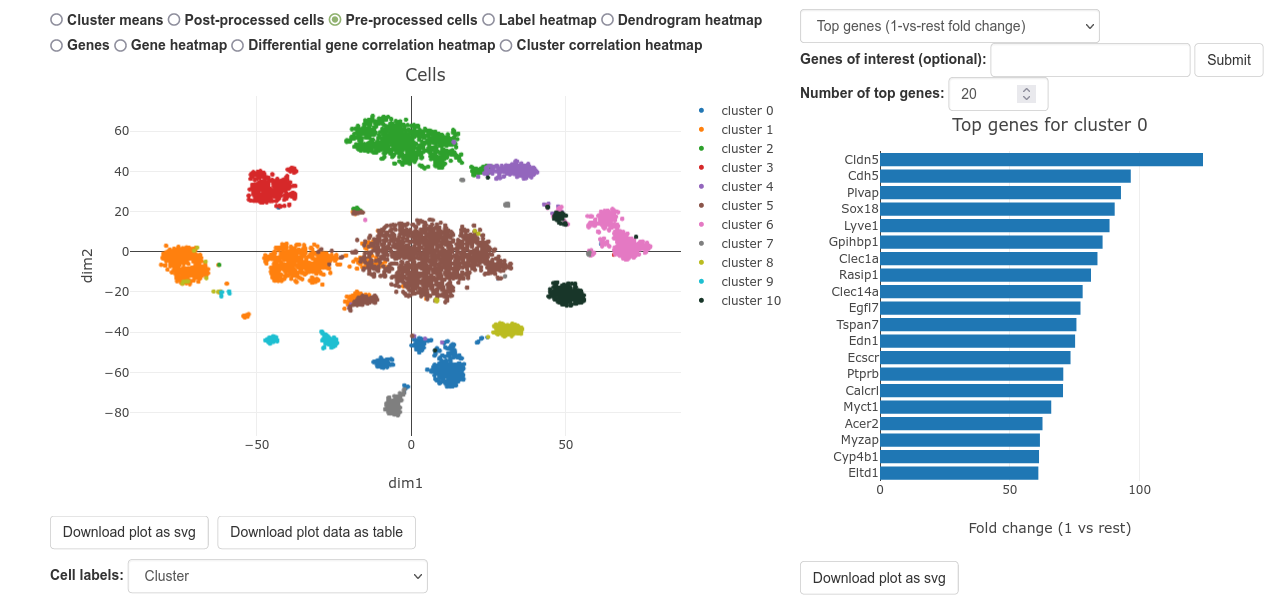
After UNCURL has finished running, you will be redirected to a page that looks like the one above. The graph on the left is a scatterplot that shows a dimensionally reduced view of the cells or cluster means. The graph on the right shows the top genes for the selected cluster, or relationships between clusters.
To change the scatterplot view, click on the radio buttons above the plot, circled in red. The default view shows a scatterplot of all of the cells in the uploaded dataset.
To change the cluster being shown on the barplot, click on any cell or cluster mean.
To change the color scheme, use the "Label scheme" dropdown. This also allows you to upload a new color scheme for visualization.
Double click on a cluster name to see only that cluster. Single click on a cluster name in the legend to toggle its visibility.
Mousing over the top right of the plot will show a control panel. This allows you to zoom in/out, select cells, or save the plot.
Scatterplot views
You can select different views for the main scatterplot by clicking on the radio buttons above. There are a number of different scatterplot views:
- Pre-processed cells - This is the default view, which shows each cell as a dot on a 2D plane. The underlying data comes from a tSNE or other dimensionality reduction method.
- Post-processed cells - This is the same as the previous, but uses the post-UNCURL data as input into the dimensionality reduction.
- Cluster means - This shows the mean position of each cluster as a point.
- Label heatmap - This view shows the relationship between two different label sets. The colors represent the overlap between cells.
- Dendrogram heatmap - This shows a dendrogram of the selected genes for the clusters.
- Gene - This shows each gene as a dot. The underlying data comes from a umap treating each gene as a data point.
- Gene heatmap - This shows the correlations among a set of genes.
Barplot views
You can select different views for the barplot by selecting them in the dropdown on the top right of the page. There are a number of different barplot views:
- Top genes (1-vs-rest fold change) - The default view. This shows the genes for the selected cluster that have the highest fold change compared to the rest of the cells. Click on a cell on the scatterplot, and the corresponding cluster will be shown here.
- Top genes (p-value of fold change) - This shows the genes for the selected cluster that have the lowest p-value of the fold change, based on a t-test. Again, clicking on a cell from the scatterplot will show the results for the cell's cluster here.
- Pairwise fold change - This allows the user to test the differential expression between two selected clusters, showing the genes with the highest fold-change between cluster 1 and cluster 2.
- Pairwise p-value - Same as above, but for the genes with the lowest p-value (or FDR) of the t-test.
- Pairwise volcano plot - Comparing two clusters, this shows the p-value (or FDR) of each gene plotted against the fold change between the two clusters.
- Violin plots for a gene - This shows violin plots of the expression values a given gene (or genes) for all clusters.
- Highly expressed genes - This shows the most highly expressed genes in the selected cluster, based on average gene expression levels.
Cell labels
The cell labels dropdown, below the scatterplot, allows the user to change the color scheme used for the scatterplot. If a set of categorical cell labels is uploaded or created, UNCURL-App will automatically calculate differential expression for those cell labels, which will be shown on the barplot. Here are the options for cell labels:
- Cluster - colors the cells based on the inferred clusters.
- Entropy - colors the cell based on
- Gene - colors the cells based on the expression level for a specified gene or genes (sum of expression, input as a space-separated list).
- Cluster weights - colors the cells based
- Read counts - colors the cells based on read counts.
- Upload cell labels - This allows the user to upload custom cell labels. The uploaded file should have a line for every cell uploaded, and each line should have a cluster name or ID. After uploading the cell labels, this dropdown will be updated to include the name of the uploaded file as one of the options.
- Custom cell selection - This allows the user to create custom cell selections based on various features. The user may select cells based on combinations of existing clusters, gene expression, or uploaded cell labels.
Gene set databases
UNCURL-App currently contains interfaces to three gene set databases: Enrichr, CellMarker, and CellMeSH. These databases can be used to aid in identifying cell types corresponding to clusters.
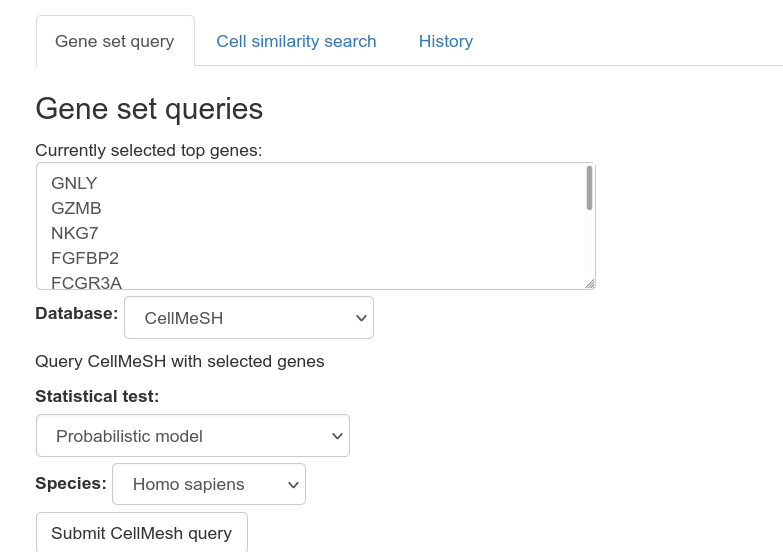
CellMeSH
CellMeSH is the default database that can be used to help identify the cell type of a given cluster. CellMeSH currently includes human and mouse genes/cell types.
To use CellMeSH to identify the cell type of a cluster:
- Click on a cell on the scatterplot. The set of genes used in the cell type query are the same genes that are shown on the barplot. Changing the barplot view will change the genes that are used for querying.
- On the very bottom of the screen, click "Submit CellMesH query". Then, a list of cell types will be shown, ordered by descending similarity to the query.
Other gene set databases can be queried in the same way as CellMesh.
CellMeSH-Anatomy
This is the same as the CellMeSH database, but it allows queries for tissue types and organs rather than just cell types.
Enrichr
This is an interface to the Enrichr tool (http://amp.pharm.mssm.edu/Enrichr/). This does not include all gene set libraries present in Enrichr, just the ones that might be helpful in identifying cell types.
CellMarker
A copy of the CellMarker database can be used for cell type identification/gene set querying.
Gene Ontology
This is an interface to a subset of Gene Ontology, allowing the user to identify GO terms that have a significant overlap with the query.
KEGG
This is an interface to a subset of the KEGG Pathway Database.
Merging, splitting, re-analysis
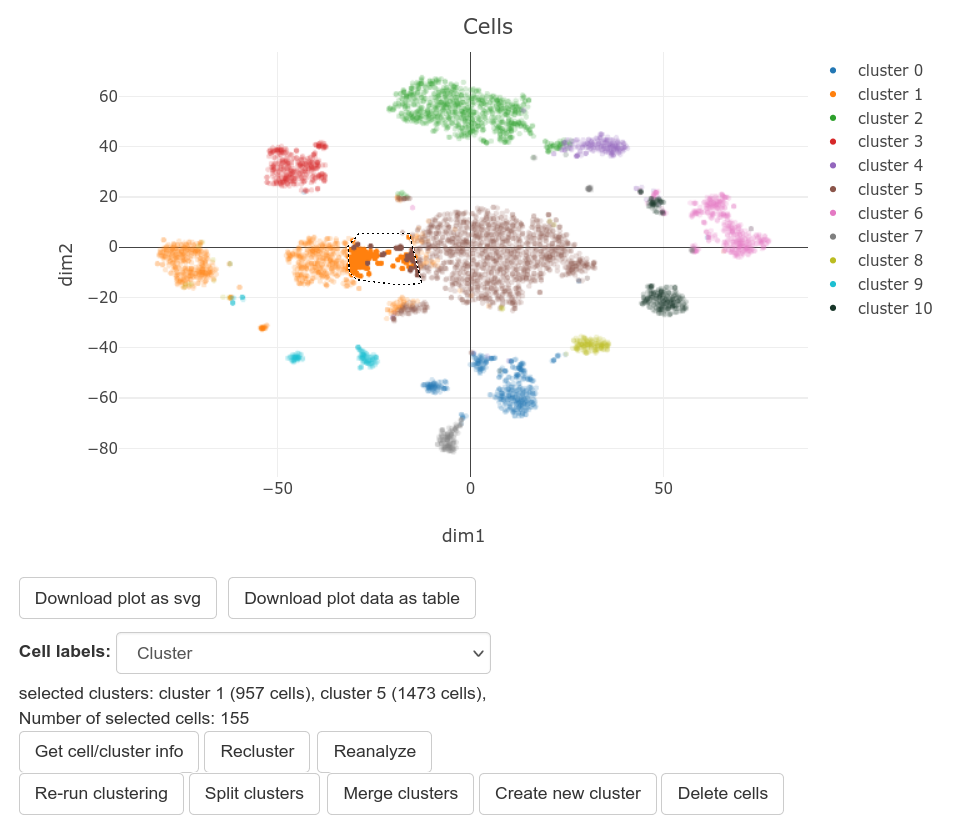
Using the scatterplot, the user can merge or split existing clusters, or create a new cluster from selected cells.
To merge multiple clusters:
- Mouse over to the top right corner of the screen, and select either the "Box Select" or "Lasso Select" tool.
- Draw a border around the clusters that should be merged. You should see a text box below the scatterplot that mentions the selected clusters.
- Click on the "Recluster" button below the scatterplot, and then click "Merge clusters".
- Wait for the process to finish. It might take around the same time as the original data upload.
To split a cluster:
- Click on a cell belonging to the cluster that should be split.
- Click on the "Recluster" button, and then click "Split clusters".
- Wait for the process to finish. It might take around the same time as the original data upload.
To delete a group of cells:
- Mouse over to the top right corner of the screen, and select either the "Box Select" or "Lasso Select" tool.
- Draw a border around the cells that should be deleted. You should see a text box below the scatterplot that mentions the selected clusters and number of cells.
- Click on the "Recluster" button below the scatterplot, and then click "Delete cells".
- Wait for the process to finish. It might take around the same time as the original data upload.
To assign a group of cells to a new cluster:
- Mouse over to the top right corner of the screen, and select either the "Box Select" or "Lasso Select" tool.
- Draw a border around the cells that should be reassigned.
- Click on the "Recluster" button below the scatterplot, and then click "Create new cluster".
- Wait for the process to finish. It might take around the same time as the original data upload.
To re-run UNCURL-App on a subset of cells or clusters:
- Mouse over to the top right corner of the screen, and select either the "Box Select" or "Lasso Select" tool.
- Draw a border around the cells or clusters that should be reassigned.
- Click on the "Reanalyze" button below the scatterplot. Then, click either "Sub-select cells" or "Sub-select clusters".
History
Every reclustering action generates a log entry. Clicking on the "History" tab, below the scatterplot, shows the log of previous actions, from oldest to newest. Selecting "Restore previous" will restore the clustering analysis to the state before the selected action.
Known issues
Sometimes, after starting a re-clustering operation, the page will be stuck on the loading screen for much longer than expected. There is a good chance that refreshing the page would solve the issue, so if the re-clustering takes longer than the original data upload process, just refresh the page..
Experimental features
These features are not supported.
Cell similarity search
This queries for the selected cluster using annotated RNA-seq libraries. Currently this is not available on the online server.